Why SVG Generation Needs a New Scorecard: Methods, Metrics, and Remaining Challenges
Haonan Zhu, Adrienne Deganutti, Purvanshi Mehta
12 mins
Jan 27, 2026

What is an SVG file?
Graphic design is a highly iterative process: you sketch, refine, and revise in cycles until the image matches your vision. SVG (Scalable Vector Graphics) is a file format where a drawing is stored as editable instructions such as “draw this curve,” “fill this shape,” “move or scale this group” instead of pixels.
The animation below is a helpful mental model for a graphic designer’s step-by-step SVG production process; SVG can be seen (loosely) as a “mathematical recipe” for the entire drawing process.
Figure 1: Each SVG command adds a small piece, and together they reconstruct the full design like a precise blueprint for the drawing. “Paint Class GIF” — Carlotta Notaro (Behance, published Aug 11, 2019). [16]
SVG code describes shapes, strokes, fills and transforms using a structured syntax. The rendering process (i.e., converting SVG to a viewable image asset such as PNG) can be understood as a drawing pipeline that interprets each element step-by-step to gradually compose the final image.
Figure 2: SVG code generated by GPT-5.2 shown as a step-by-step rendering process.
Why are SVGs Important?
SVG is the most common image format used on the web (about 65% of websites [2]). A major reason is that SVG represents graphics as editable drawing instructions rather than pixels [3]. In practice, this brings several advantages:
High-resolution at any size: SVGs scale cleanly without becoming blurry, which is ideal for high-resolution and responsive screens. The same SVG file can be used on a mobile app, or a building-sized billboard.
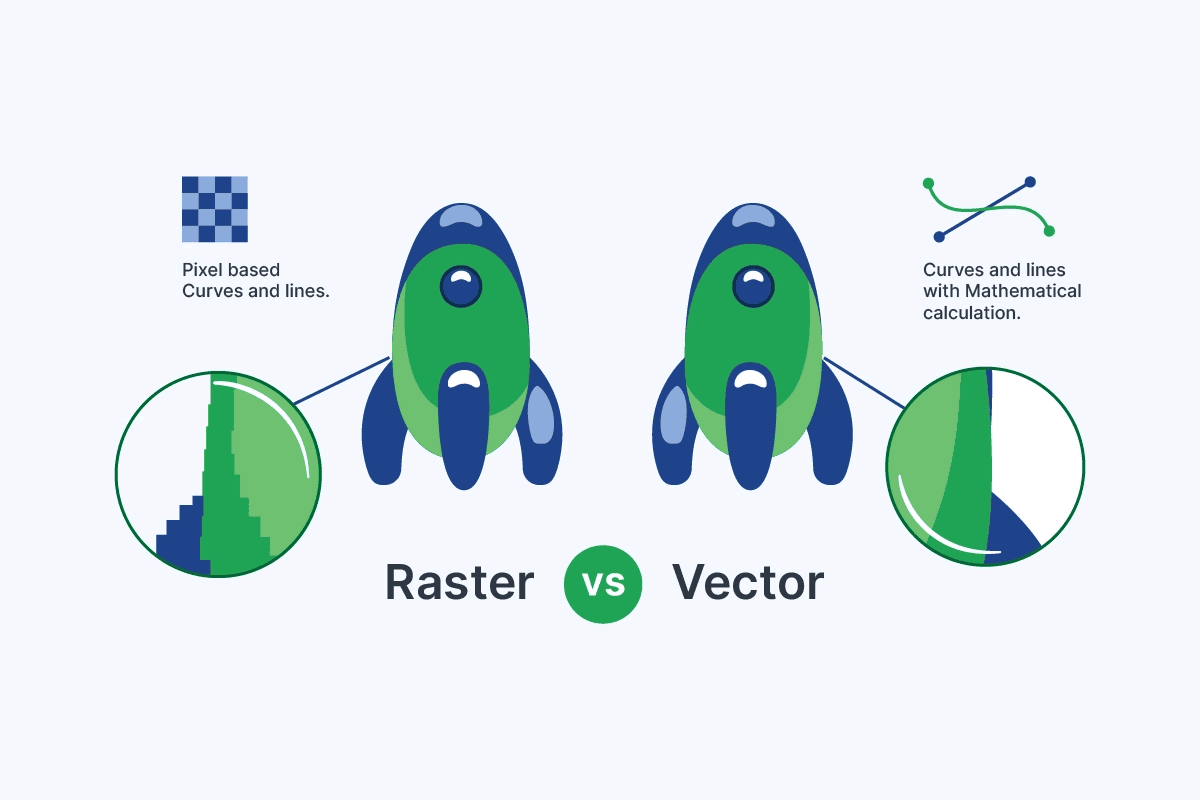
Figure 3: Raster images (JPG/PNG) are pixel-based and blur when scaled, whereas vector images (SVG) use mathematical paths and stay crisp at any size. [17]
Lightweight and easy to maintain: SVG file sizes are often small because the image is stored as compact shape instructions rather than pixel data. And because SVG is text-based, files are easy to edit and reuse across projects [3,4].
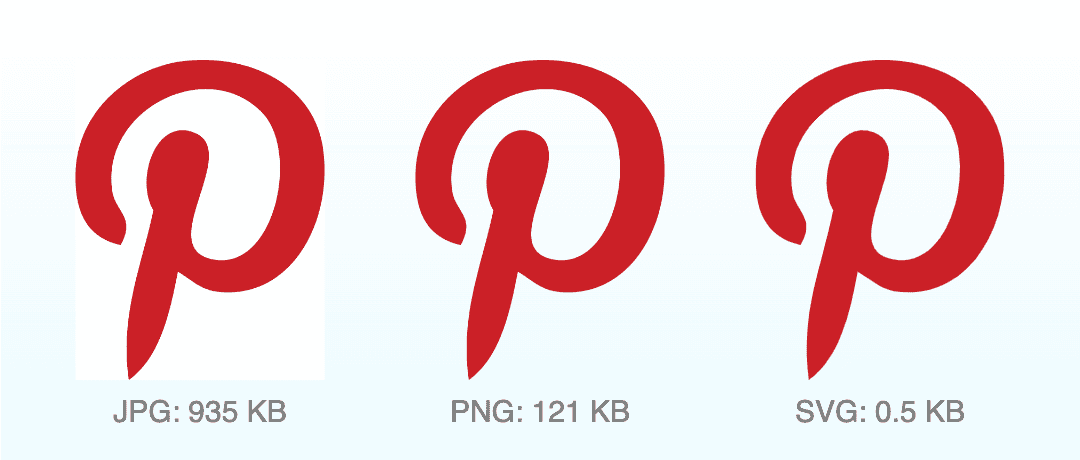
Figure 4: Comparison of Pinterest logo file sizes for a high-quality render across JPG, PNG, and SVG. [18]
Searchable and accessible: elements and labels can be indexed and searched, and text can remain real text (supporting accessibility tools such as screen readers) [3,5]. As a result, icons, diagrams or texts in SVG files are discoverable via site search, docs search, and in-browser ‘Find’. This also makes them easier to maintain and edit, since individual elements can be reliably targeted (e.g., by IDs/classes).
Web-native and interactive: SVGs integrate well with the web platform—you can style them, script them, and animate them—making them widely used for logos, icons, charts, infographics, and illustrations, where clarity and interactivity matter [3,4,5].
Figure 5: SVG icons are lightweight and stylable, making them ideal for web interfaces.
SVG’s advantages are appealing but producing high-quality vector assets remains costly in production.
“Vector-ready” files often require both artistic judgment and practical constraints (clean shapes, consistent structure, and reliable performance). In many teams, that cost shows up as specialized roles and frequent raster-to-vector conversions, and handoff overhead where a single detailed illustration could cost more than $1500 (estimated from [15]).
SVG Generation: State of the Art
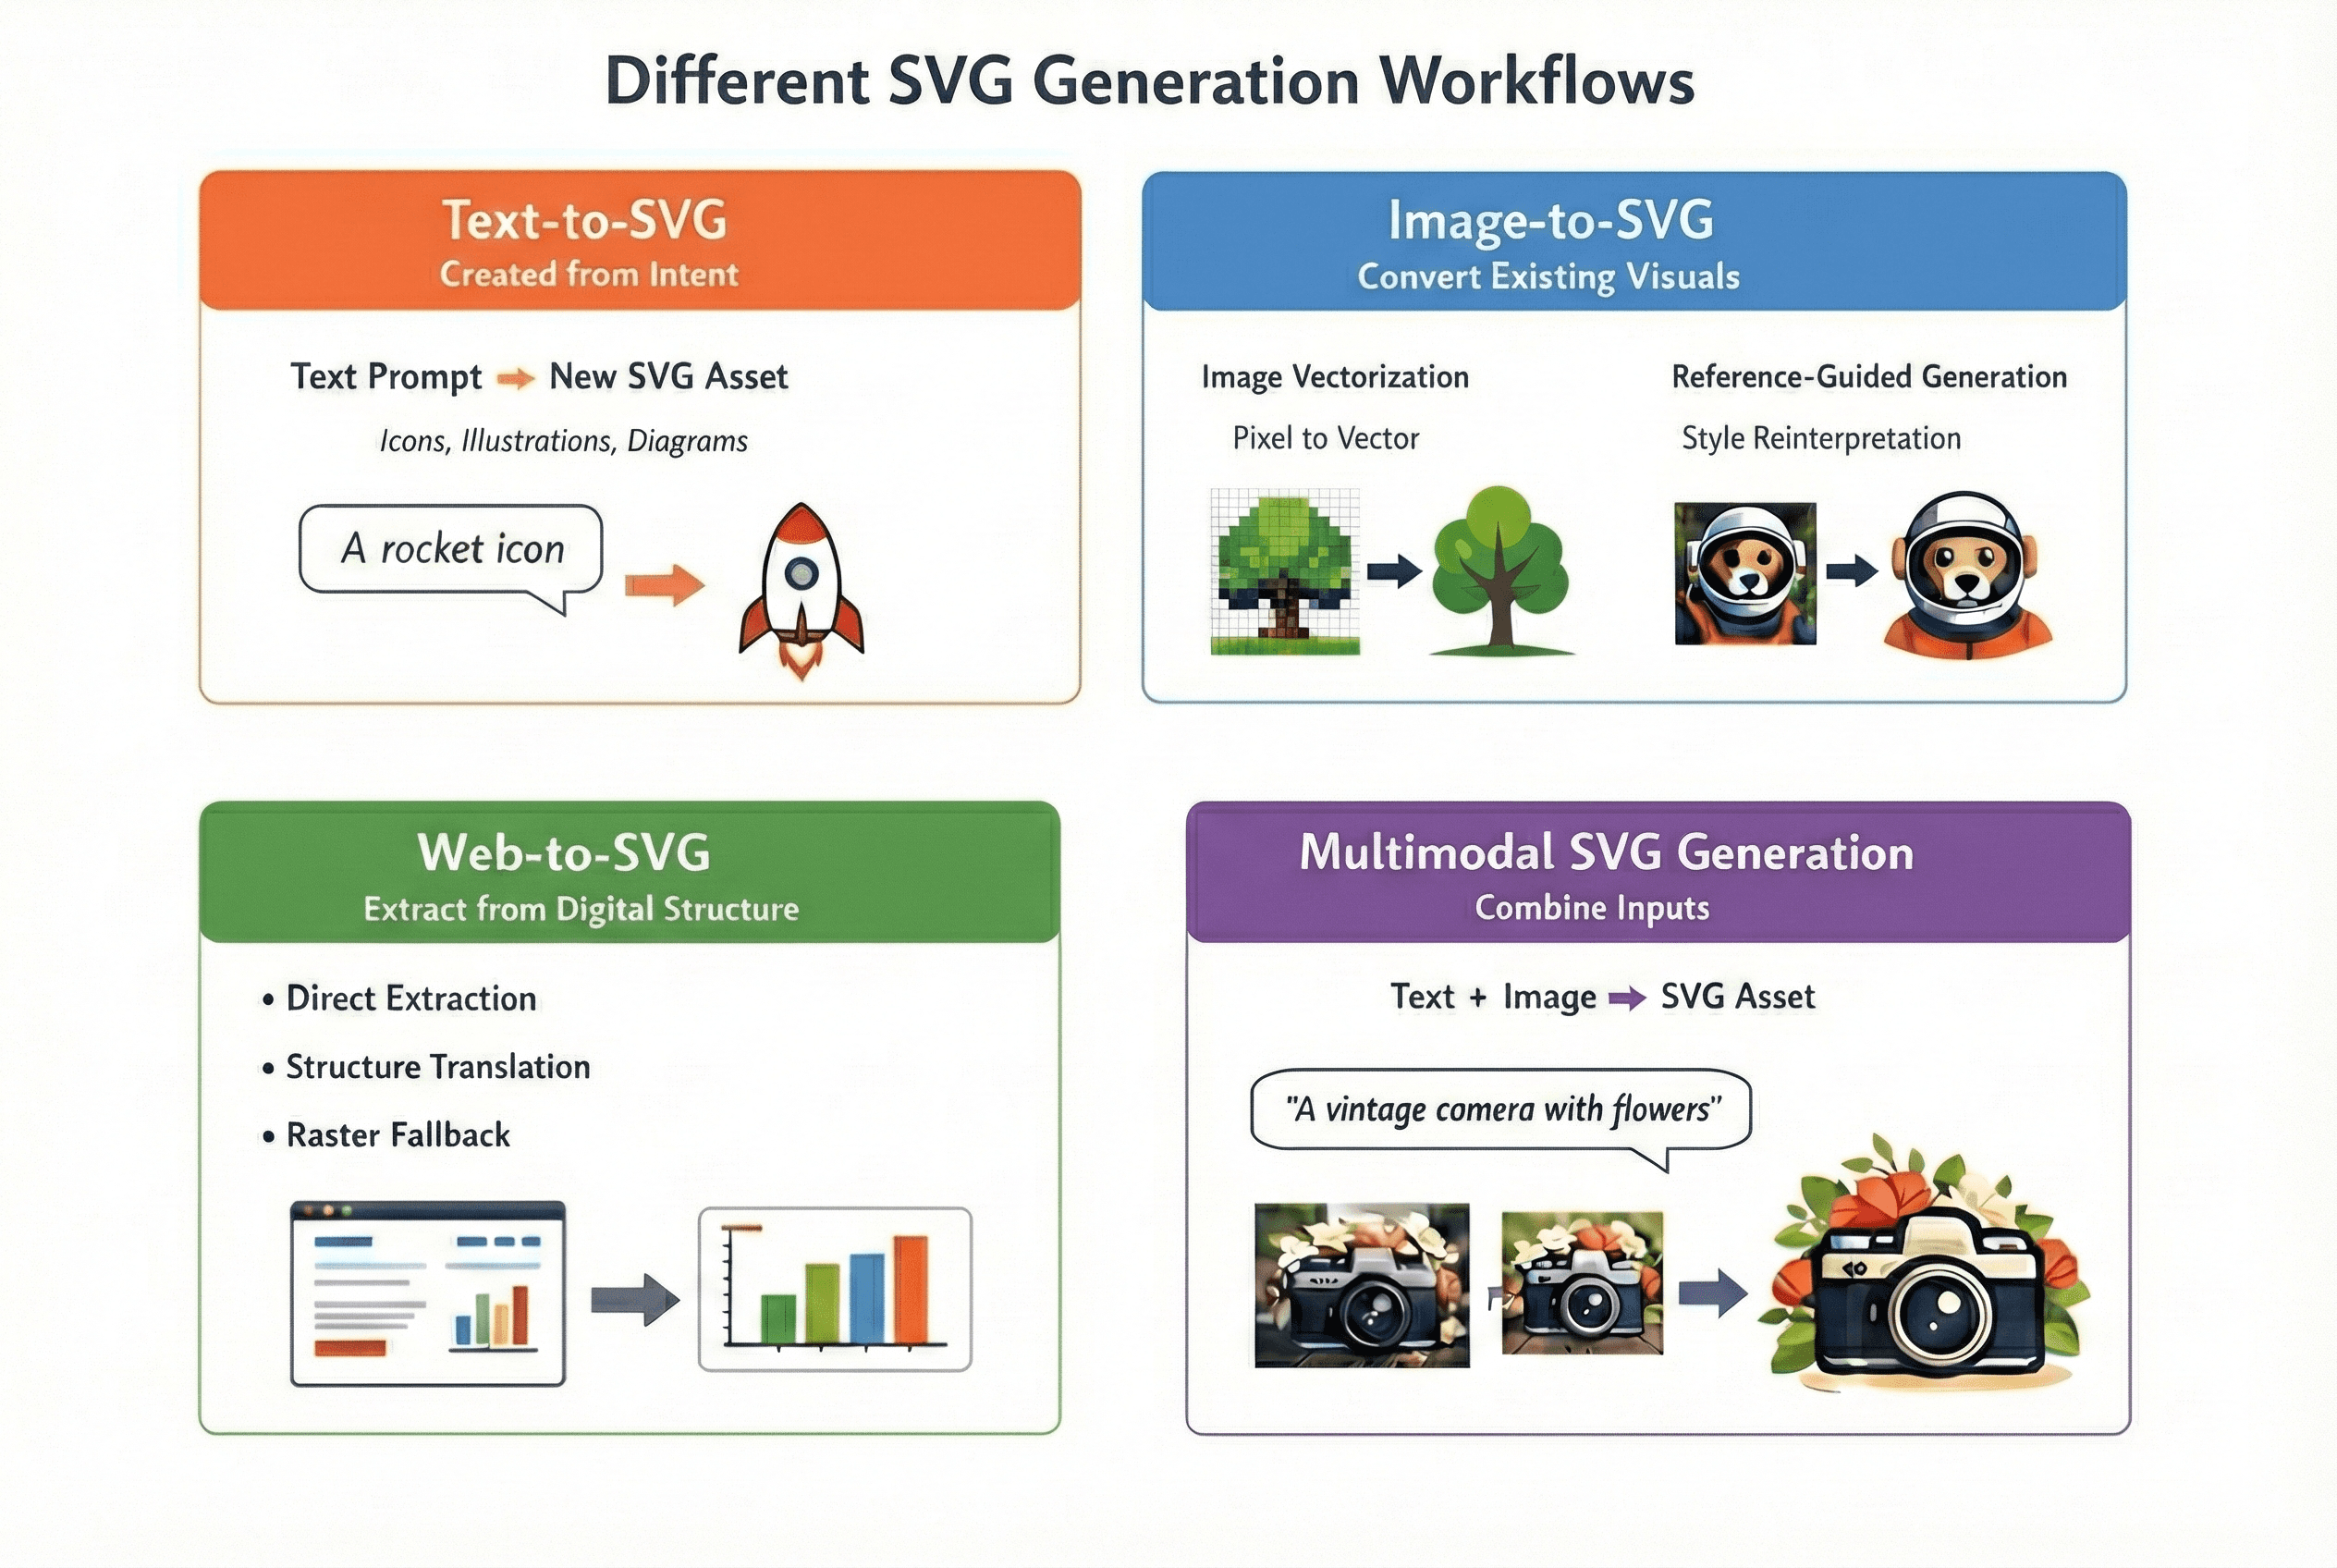
Figure 6: overview of different SVG generation workflows
In practice, SVG generation can be broadly categorized into four workflows—depending on whether you’re creating new assets, converting existing visuals, extracting vectors from existing digital content or combining these approaches:
Text-to-SVG (created from intent): used when you want new vector assets from a description (icons, illustrations, diagrams in-house style).
Image-to-SVG (convert existing visuals): used when you start from existing visuals in pixels (e.g., PNGs, JPEGs) and need them in vector format (logos, flat art, screenshots, scanned drawings). This further splits into:
Image vectorization (trace): recover shapes and curves from pixels.
Reference-guided generation (reinterpret): keep the composition or style cues but output a simplified or standardized vector asset.
Web-to-SVG (extract or translate from digital structure): used when the “source” is already digital and structured (web pages, UI, charts, diagrams). In practice, it usually falls into:
Direct extraction (the page already contains SVG assets)
Structure translation (DOM/CSS/layout → SVG)
Raster fallback (canvas/WebGL → screenshot → vectorization)
Multimodal SVG Generation (combine inputs): used when multiple sources of input (e.g., text description and image) are available. Below is an example of multimodal SVG generation where we input both a description and image to the Qwen3-VL model to generate the SVG code.
Figure 7: sample flow of using qwen3-vl for multimodal SVG generation
Text-to-SVG and image-to-SVG are the core building blocks that multimodal and web-based pipelines often rely on. This article focuses on text-to-SVG and image-to-SVG generation which share the same goal: turning an input into editable vector artwork. With text, you start from an idea (“a cat icon”), so the system must invent the shapes and style. With an image, you start from pixels, so the system must translate what it sees into clean vector shapes. Either way, the hard part isn’t only “does it look right?”—it’s also “is this SVG usable?” (reasonable number of shapes, sensible layering, and output that edits well).
There are two family of approaches to address the SVG generation problem:

Figure 8: overview of SVG generation methods
Image Processing-Based
Classic image-to-SVG typically uses edge detection image processing methods. The most common method is the Potrace algorithm that traces the boundaries between black and white pixels. Such methods have the advantage of effectively preserving topology because they do not process the image semantically, but rather enforce spatial logic. There is no notion of “what object this is,” only “where the boundary lies.” However, the performance of these methods decreases as the complexity of the image increases.
Machine Learning Based, which consists of:
Image generation model-guided SVG generation (e.g., diffusion models), has two main steps: 1) generate the initial rasterized image using existing image generation models such as Google’s Nano Banana, 2) convert the generated image into SVG codes using either classical vectorization algorithms mentioned above or optimization-based method. While offering high-quality images after rendering, these methods also suffer the lack of edibility in their produced SVG code.
Model-based code generation, where a trained (vision) language model like OpenAI’s ChatGPT, outputs SVG code directly token-by-token given a user prompt or image. Below is a video demonstration of how this process looks. While offering greater editability, these methods are limited to simple SVG files such as icons, and the quality of the generated image degrades noticeably when testing on samples distinct from the training data.
Evaluation Metrics
With all these approaches for SVG generation, how do we quantitatively decide which SVG is more usable than the others?
The existing metrics in literature can be organized into the following categories:
Metric Cateogory | Alignment Scores | Pixel-based Metrics | Distribution level metrics | Human preference scores | Code Level |
|---|---|---|---|---|---|
Description | measures how “aligned” the generated SVG is to the input (text, or image) | measures how “faithful” the generated SVG (after rendering) is to the reference image | measures dataset-level similarity between the generated SVGs and the original images | models trained on human preference data to score images | assess how “complex” the generated SVG code is |
Examples | CLIP Score, DinoScore | Mean Squared Error (MSE), Structural Similarity Index (SSIM), Learned Perceptual Image Patch Similarity (LPIPS) | Fréchet inception distance (FID), FID-CLIP | HPSv2, PickScore, ImageReward | Code length, Number of paths, Number of commands [14] |
Table 1: overview of evaluation metrics for SVG generation
Demonstrations
Following is a demonstration of applying these metrics to various SVG generation tasks for five examples.
Rasterized SVG metrics (guitar example): CLIP text-to-image can reward “overall vibe” even when the object is wrong (morphed guitar), suggesting weak keyword/object prioritization. CLIP image-to-image struggles to score shape–color trade-offs (OmniSVG gets the silhouette but misses color). Pixel metrics (e.g., MSE) over-weight spatial alignment: OmniSVG scores well despite wrong colors, while Claude scores worse despite correct colors but mismatched geometry. Human-preference models can favor simplicity over useful detail (e.g., penalizing added strings).
Code-level metrics: VTracer often yields the highest-fidelity image-to-SVG outputs, but its SVG is ~10× longer and dominated by long cubic Bézier paths, making edits painful compared to more structured, commented ML-generated SVG—highlighting a fidelity vs. readability trade-off.
<?xml version="1.0" encoding="UTF-8"?>
<!-- Generator: visioncortex VTracer -->
<svg id="svg" version="1.1" xmlns="<http://www.w3.org/2000/svg>" style="display: block;" viewBox="0 0 512 512"><path d="M0 0 C168.96 0 337.92 0 512 0 C512 168.96 512 337.92 512 512 C343.04 512 174.08 512 0 512 C0 343.04 0 174.08 0 0 Z " transform="translate(0,0)" style="fill: #FEFEFE;"/>
In summary, while existing metrics are correlated with "quality," they are an approximation of what we are aiming for and misleading at times.
Figure 9: misaligned objective
What is a good objective?
This suggests a need for better metrics, and it remains an open question on how to quantify:
Alignment: Does the output match the intent (prompt or source image), not just visually, but structurally? Should a "logo" request produce a single cohesive group, while a "diagram" request produce labeled, semantically-organized layers? How do we balance shapes and colors?
Visual Quality: Beyond pixel-level metrics with respect to a reference image, how do we measure aesthetic properties like balance, proportion, and style consistency that matter in real design contexts. Existing models trained on natural images are not ideal for design tasks as reflected by HPSv2 in our demonstration.
Editability: while metrics such as code length offers an initial complexity assessment, the question remains in how to quantify the "designer-readiness" of an SVG (i.e., measuring layer organization, naming conventions, and adherence to design system constraints that determine whether a vector asset can actually be maintained in production).
Until we develop metrics that capture these practical dimensions, SVG generation will continue to struggle to balance between correct outputs and professionally usable assets.
Summary
In this blog post, we have covered:
What are SVGs, and why are they important.
Different tasks in SVG generations.
A tour of existing SVG generation methods, which includes:
Image processing based methods
Machine Learning based methods
Evaluation Metrics, which reveals:
Image processing based methods are often “faithful” but not “readable”
Machine Learning based method are often “readable” but not “faithful”
The remaining challenges:
Evaluation metrics: what should be our goal post?
Trade off between Quality and Readability/Edibility
Footnote: For interested reader, the Awesome-SVG-Generation [12] and Awesome-Sketch-Synthesis [13] lists are good starting hubs.
References:
https://www.adobe.com/creativecloud/file-types/image/vector/svg-file.html
https://www.bls.gov/ooh/arts-and-design/graphic-designers.htm
https://www.bls.gov/ooh/arts-and-design/multimedia-artists-and-animators.htm
https://helpx.adobe.com/in/illustrator/using/image-trace.html
https://github.com/airbnb/lottie/blob/master/supported-features.md
https://github.com/Melmaphother/Awesome-SVG-Generation?tab=readme-ov-file
https://github.com/MarkMoHR/Awesome-Sketch-Synthesis?tab=readme-ov-file
What is an SVG file?
Graphic design is a highly iterative process: you sketch, refine, and revise in cycles until the image matches your vision. SVG (Scalable Vector Graphics) is a file format where a drawing is stored as editable instructions such as “draw this curve,” “fill this shape,” “move or scale this group” instead of pixels.
The animation below is a helpful mental model for a graphic designer’s step-by-step SVG production process; SVG can be seen (loosely) as a “mathematical recipe” for the entire drawing process.
Figure 1: Each SVG command adds a small piece, and together they reconstruct the full design like a precise blueprint for the drawing. “Paint Class GIF” — Carlotta Notaro (Behance, published Aug 11, 2019). [16]
SVG code describes shapes, strokes, fills and transforms using a structured syntax. The rendering process (i.e., converting SVG to a viewable image asset such as PNG) can be understood as a drawing pipeline that interprets each element step-by-step to gradually compose the final image.
Figure 2: SVG code generated by GPT-5.2 shown as a step-by-step rendering process.
Why are SVGs Important?
SVG is the most common image format used on the web (about 65% of websites [2]). A major reason is that SVG represents graphics as editable drawing instructions rather than pixels [3]. In practice, this brings several advantages:
High-resolution at any size: SVGs scale cleanly without becoming blurry, which is ideal for high-resolution and responsive screens. The same SVG file can be used on a mobile app, or a building-sized billboard.
Figure 3: Raster images (JPG/PNG) are pixel-based and blur when scaled, whereas vector images (SVG) use mathematical paths and stay crisp at any size. [17]
Lightweight and easy to maintain: SVG file sizes are often small because the image is stored as compact shape instructions rather than pixel data. And because SVG is text-based, files are easy to edit and reuse across projects [3,4].
Figure 4: Comparison of Pinterest logo file sizes for a high-quality render across JPG, PNG, and SVG. [18]
Searchable and accessible: elements and labels can be indexed and searched, and text can remain real text (supporting accessibility tools such as screen readers) [3,5]. As a result, icons, diagrams or texts in SVG files are discoverable via site search, docs search, and in-browser ‘Find’. This also makes them easier to maintain and edit, since individual elements can be reliably targeted (e.g., by IDs/classes).
Web-native and interactive: SVGs integrate well with the web platform—you can style them, script them, and animate them—making them widely used for logos, icons, charts, infographics, and illustrations, where clarity and interactivity matter [3,4,5].
Figure 5: SVG icons are lightweight and stylable, making them ideal for web interfaces.
SVG’s advantages are appealing but producing high-quality vector assets remains costly in production.
“Vector-ready” files often require both artistic judgment and practical constraints (clean shapes, consistent structure, and reliable performance). In many teams, that cost shows up as specialized roles and frequent raster-to-vector conversions, and handoff overhead where a single detailed illustration could cost more than $1500 (estimated from [15]).
SVG Generation: State of the Art
Figure 6: overview of different SVG generation workflows
In practice, SVG generation can be broadly categorized into four workflows—depending on whether you’re creating new assets, converting existing visuals, extracting vectors from existing digital content or combining these approaches:
Text-to-SVG (created from intent): used when you want new vector assets from a description (icons, illustrations, diagrams in-house style).
Image-to-SVG (convert existing visuals): used when you start from existing visuals in pixels (e.g., PNGs, JPEGs) and need them in vector format (logos, flat art, screenshots, scanned drawings). This further splits into:
Image vectorization (trace): recover shapes and curves from pixels.
Reference-guided generation (reinterpret): keep the composition or style cues but output a simplified or standardized vector asset.
Web-to-SVG (extract or translate from digital structure): used when the “source” is already digital and structured (web pages, UI, charts, diagrams). In practice, it usually falls into:
Direct extraction (the page already contains SVG assets)
Structure translation (DOM/CSS/layout → SVG)
Raster fallback (canvas/WebGL → screenshot → vectorization)
Multimodal SVG Generation (combine inputs): used when multiple sources of input (e.g., text description and image) are available. Below is an example of multimodal SVG generation where we input both a description and image to the Qwen3-VL model to generate the SVG code.
Figure 7: sample flow of using qwen3-vl for multimodal SVG generation
Text-to-SVG and image-to-SVG are the core building blocks that multimodal and web-based pipelines often rely on. This article focuses on text-to-SVG and image-to-SVG generation which share the same goal: turning an input into editable vector artwork. With text, you start from an idea (“a cat icon”), so the system must invent the shapes and style. With an image, you start from pixels, so the system must translate what it sees into clean vector shapes. Either way, the hard part isn’t only “does it look right?”—it’s also “is this SVG usable?” (reasonable number of shapes, sensible layering, and output that edits well).
There are two family of approaches to address the SVG generation problem:
Figure 8: overview of SVG generation methods
Image Processing-Based
Classic image-to-SVG typically uses edge detection image processing methods. The most common method is the Potrace algorithm that traces the boundaries between black and white pixels. Such methods have the advantage of effectively preserving topology because they do not process the image semantically, but rather enforce spatial logic. There is no notion of “what object this is,” only “where the boundary lies.” However, the performance of these methods decreases as the complexity of the image increases.
Machine Learning Based, which consists of:
Image generation model-guided SVG generation (e.g., diffusion models), has two main steps: 1) generate the initial rasterized image using existing image generation models such as Google’s Nano Banana, 2) convert the generated image into SVG codes using either classical vectorization algorithms mentioned above or optimization-based method. While offering high-quality images after rendering, these methods also suffer the lack of edibility in their produced SVG code.
Model-based code generation, where a trained (vision) language model like OpenAI’s ChatGPT, outputs SVG code directly token-by-token given a user prompt or image. Below is a video demonstration of how this process looks. While offering greater editability, these methods are limited to simple SVG files such as icons, and the quality of the generated image degrades noticeably when testing on samples distinct from the training data.
Evaluation Metrics
With all these approaches for SVG generation, how do we quantitatively decide which SVG is more usable than the others?
The existing metrics in literature can be organized into the following categories:
Metric Cateogory | Alignment Scores | Pixel-based Metrics | Distribution level metrics | Human preference scores | Code Level |
|---|---|---|---|---|---|
Description | measures how “aligned” the generated SVG is to the input (text, or image) | measures how “faithful” the generated SVG (after rendering) is to the reference image | measures dataset-level similarity between the generated SVGs and the original images | models trained on human preference data to score images | assess how “complex” the generated SVG code is |
Examples | CLIP Score, DinoScore | Mean Squared Error (MSE), Structural Similarity Index (SSIM), Learned Perceptual Image Patch Similarity (LPIPS) | Fréchet inception distance (FID), FID-CLIP | HPSv2, PickScore, ImageReward | Code length, Number of paths, Number of commands [14] |
Table 1: overview of evaluation metrics for SVG generation
Demonstrations
Following is a demonstration of applying these metrics to various SVG generation tasks for five examples.
Rasterized SVG metrics (guitar example): CLIP text-to-image can reward “overall vibe” even when the object is wrong (morphed guitar), suggesting weak keyword/object prioritization. CLIP image-to-image struggles to score shape–color trade-offs (OmniSVG gets the silhouette but misses color). Pixel metrics (e.g., MSE) over-weight spatial alignment: OmniSVG scores well despite wrong colors, while Claude scores worse despite correct colors but mismatched geometry. Human-preference models can favor simplicity over useful detail (e.g., penalizing added strings).
Code-level metrics: VTracer often yields the highest-fidelity image-to-SVG outputs, but its SVG is ~10× longer and dominated by long cubic Bézier paths, making edits painful compared to more structured, commented ML-generated SVG—highlighting a fidelity vs. readability trade-off.
<?xml version="1.0" encoding="UTF-8"?>
<!-- Generator: visioncortex VTracer -->
<svg id="svg" version="1.1" xmlns="<http://www.w3.org/2000/svg>" style="display: block;" viewBox="0 0 512 512"><path d="M0 0 C168.96 0 337.92 0 512 0 C512 168.96 512 337.92 512 512 C343.04 512 174.08 512 0 512 C0 343.04 0 174.08 0 0 Z " transform="translate(0,0)" style="fill: #FEFEFE;"/>
In summary, while existing metrics are correlated with "quality," they are an approximation of what we are aiming for and misleading at times.
Figure 9: misaligned objective
What is a good objective?
This suggests a need for better metrics, and it remains an open question on how to quantify:
Alignment: Does the output match the intent (prompt or source image), not just visually, but structurally? Should a "logo" request produce a single cohesive group, while a "diagram" request produce labeled, semantically-organized layers? How do we balance shapes and colors?
Visual Quality: Beyond pixel-level metrics with respect to a reference image, how do we measure aesthetic properties like balance, proportion, and style consistency that matter in real design contexts. Existing models trained on natural images are not ideal for design tasks as reflected by HPSv2 in our demonstration.
Editability: while metrics such as code length offers an initial complexity assessment, the question remains in how to quantify the "designer-readiness" of an SVG (i.e., measuring layer organization, naming conventions, and adherence to design system constraints that determine whether a vector asset can actually be maintained in production).
Until we develop metrics that capture these practical dimensions, SVG generation will continue to struggle to balance between correct outputs and professionally usable assets.
Summary
In this blog post, we have covered:
What are SVGs, and why are they important.
Different tasks in SVG generations.
A tour of existing SVG generation methods, which includes:
Image processing based methods
Machine Learning based methods
Evaluation Metrics, which reveals:
Image processing based methods are often “faithful” but not “readable”
Machine Learning based method are often “readable” but not “faithful”
The remaining challenges:
Evaluation metrics: what should be our goal post?
Trade off between Quality and Readability/Edibility
Footnote: For interested reader, the Awesome-SVG-Generation [12] and Awesome-Sketch-Synthesis [13] lists are good starting hubs.
References:
https://www.adobe.com/creativecloud/file-types/image/vector/svg-file.html
https://www.bls.gov/ooh/arts-and-design/graphic-designers.htm
https://www.bls.gov/ooh/arts-and-design/multimedia-artists-and-animators.htm
https://helpx.adobe.com/in/illustrator/using/image-trace.html
https://github.com/airbnb/lottie/blob/master/supported-features.md
https://github.com/Melmaphother/Awesome-SVG-Generation?tab=readme-ov-file
https://github.com/MarkMoHR/Awesome-Sketch-Synthesis?tab=readme-ov-file